


This experiment demonstrates the principles of passive transport and how concentration gradients affect the movement of molecules across a membrane by examining the movement of solutes such as potassium iodide and glucose and tracking their weight changes at different sucrose concentrations. The purpose is to demonstrate that it has a positive impact.
This experiment investigates how different concentrations of solutes affect the processes of osmosis and diffusion across a semipermeable membrane (dialysis tubing), and the movement of water, solutes, and the resulting solution. Examine changes in properties and weight over time.
introduction
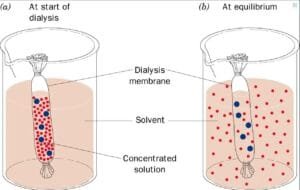
Osmosis and diffusion are fundamental processes of cellular transport and play a critical role in maintaining homeostasis and enabling essential biochemical functions (Alberts et al., 2014). Both are types of passive transport, allowing molecules to cross biological membranes without energy. Osmosis is defined as the movement of water molecules through a semipermeable membrane from an area of low solute concentration to an area of high solute concentration until equilibrium is reached. In contrast, diffusion involves the movement of solute particles from an area of high concentration to an area of low concentration (Binod, 2024).
Understanding the dynamics of these processes is necessary to examine how cells interact with their environment, absorb nutrients, and remove waste products. When it comes to osmosis, there are three main types of solutions. In hypertonicity, there is more solute outside the cell than inside, and water flows out of the cell. Hypotonic. There are fewer solutes outside the cell and water moves into the cell. In isotonicity, the concentration of solutes is the same inside and outside the cell, and there is no net movement of water (Binod, 2024).
In this experiment, the dialysis bag is used in the experiment because it is semipermeable and represents an artificial cell to study osmosis and diffusion. The hypothesis of this experiment is that the starch/glucose solution in the dialysis tubing will exhibit a color change due to the diffusion of potassium iodide. Also, the weight of the dialysis bag changes due to osmosis depending on the sucrose concentration.
Materials and methods
Steps to study diffusion and osmosis using dialysis tubing
Diffusion experiment:
- Prepare the diffusion solution.
- Fill a small beaker with water.
- Add 10 drops of potassium iodide solution to the beaker until it turns medium brown.
- Observe the spread:
- Record the initial color and appearance of the potassium iodide solution in the beaker.
- Wait for the solution to diffuse, observing the color change until the solution turns entirely yellow, indicating complete diffusion.
- Prepare dialysis tubing.
- Cut the dialysis tubing to approximately 10 cm in length.
- Clamp one end of the tube tightly and leave the other end open.
- Fill the dialysis tubing.
- Fill the open end of the dialysis tubing approximately two-thirds full with the starch/glucose solution.
- Clamp the open end of the tube firmly.
- Record your initial observations.
- Record the colors of both the potassium iodide solution in the beaker and the starch/glucose solution in the dialysis tube in Table 1.
- Dip the glucose test strip into the beaker solution and record the results in Table 2.
- Place the dialysis tubing in the beaker.
- Immerse the prepared dialysis tubing in a beaker containing potassium iodide solution.
- Wait and observe:
- After 30 minutes, record the color change of both the potassium iodide solution in the beaker and the starch/glucose solution in the dialysis tube in Table 1.
- Dip the glucose test strip back into the beaker solution and record the results in Table 2.
Penetration experiment:
After 60 min, record the final weight of all dialysis cells in Table 3.
Prepare the infiltration solution.
- Fill a small beaker about two-thirds full with the 25% sucrose solution.
- Fill a large beaker approximately two-thirds full with the 1% sucrose solution.
Prepare dialysis tubing for artificial cells.
- Obtain four soaked dialysis tubes.
- Clip one end of each piece of dialysis tubing with a clip. Label the clips A, B, C, and D.
Fill the dialysis tubing:
- Open “Cell A”, fill it two-thirds full with 1% sucrose solution, and secure it with a firm clamp.
- Fill “Cell B” with 1% sucrose solution, “Cell C” with 10% sucrose solution, and “Cell D” with 25% sucrose solution, and clamp each firmly.
Record the initial weights.
- Weigh each of the four dialysis cells and record their initial weights in Table 3.
Immerse the dialysis cell:
- Place “Cell A” in a small beaker containing 25% sucrose solution.
- Place “cells B, C, and D” into a large beaker containing 1% sucrose solution.
Wait and weigh:
- After 15 minutes, remove the cells from their respective beakers, dry slightly, and weigh.
- Record the new weight in Table 3.
- Return the cells to their respective beakers.
Repeat the weighing process:
- Repeat the process of removing, drying, weighing, and recording the weight after 30, 45, and 60 minutes.
Final weight:
- After 60 min, record the final weight of all dialysis cells in Table 3.
result
The results of the experiment show the diffusion of potassium iodide and the behavior of glucose in the dialysis tubing, as shown in the following table.
Table 1. Diffusion of potassium iodine solution from beaker to dialysis tubing to starch/glucose solution.
| potassium iodide solution | starch/glucose solution | |
| starting color | yellowish brown | white |
| ending color | clear | purple/cloudy |
Table 2. Glucose Strip Test for Diffusion
| color | Presence of glucose? | ||||
| Glucose test strips at the start | teal | negative | |||
| Finally glucose test strip | brown/green | trace amount of glucose | |||
The results of osmosis experiments are demonstrated by solute movement and weight changes within the dialysis tubing, indicating the hypertonic, hypotonic, or isotonic nature of the environment.
Table 3. Change in dialysis cell weight as a function of time.
| 0 minutes (initial weight) (gm) | 10 minute weight (gm) | 20 minute weight (gm) | 30 minute weight (gm) | 40 minute weight (gm) | |
| Cell A | 24.16 | 24.53 | 23.90 | December 24th | 24.65 |
| cell B | 19.27 | 19.31 | 19.34 | 19.30 | 19.33 |
| cell C | 24.67 | 24.58 | 24.33 | January 24th | 23.79 |
| cell D | 28.50 | 26.87 | 25.65 | 25.57 | 24.78 |
discussion
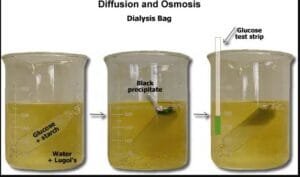
This experiment demonstrated that potassium iodide diffused into the starch/glucose solution in the dialysis tubing, causing a color change, confirming that the diffusion was successful. Furthermore, the weight of the dialysis bag varied depending on the surrounding sucrose concentration, indicating the influence of osmotic pressure. Cells in hypertonic solutions lose weight, while cells in isotonic solutions remain stable.
Initial observations revealed that the potassium iodide solution was initially yellow-brown in color, while the starch/glucose solution was white in color. After 30 minutes, the potassium iodide solution
becomes clear and the starch/glucose solution becomes purple/cloudy, indicating successful diffusion of iodine into the tube.
The glucose test strip initially showed a blue-green color, indicating the absence of glucose. At the end of the experiment, the strip turned brown/green, confirming traces of glucose in the beaker solution.
Changes in the weights over time indicate changes in response to the surrounding solution. Cell A showed a slight increase in weight after 10 min, but it fluctuated after that, indicating a hypertonic environment within the beaker. Cell B remains relatively stable, indicating an isotonic environment. In contrast, cell C showed a gradual weight loss, whereas cell D showed a significant decrease reflecting water loss due to the hypertonic environment. Solutes move from high to low concentrations to maintain homeostasis (Alberts et al., 2014).
This experiment had weaknesses, such as differences in the degree to which the dialysis tubing allowed substances to pass through, which could lead to uneven results. Also, the measurements were not controlled for temperature and relied on color changes, which may have made the results less reliable.
Overall, the results support the hypothesis that diffusion occurs across the dialysis membrane and highlight the influence of osmotic pressure on the weight of the dialysis bag.
Further experiments
Future experiments may investigate how temperature affects osmosis and diffusion, with the expectation that these processes will occur faster at higher temperatures. You can also try different substances, such as salt or sugar, to see how they change the way molecules move.
References
Alberts, B., Johnson, A., Lewis, J., Raff, M., Roberts, K., and Walter, P. (2014). molecular biology of cells (6th edition). garland science.
GC, Vinod. “Osmosis and Diffusion: Differences and Factors Influencing Them” science notebookApril 14, 2023. web. October 2, 2024. Osmosis and diffusion: differences and factors that influence them
Mika, TA, Klein, RJ, Brajahn, AE, Connor, RL, Swimmer, LM, White, RE,
Goseth, M. W., Carter, T. E., Andrews, A. M., Meyer, J. L., & Siddiq, F. (Eds.). (2024). Anatomy and Physiology BIO 211 Laboratory Manual (3rd edition). Owens Community College.
GC, Vinod. “Transportation of Mobile Phones: Passive and Active Mechanisms” science notebookSeptember 3, 2024. web. October 2, 2024. Cellular Transport: Passive and Active Mechanisms – Science Notes


